How Tactical High Yield Fits in an Investment Portfolio


When considering an investment for inclusion in a portfolio, it can be helpful to look at a few summary statistics.

  • Annualized Return gives a historical view of the long-run reward for holding the asset.
  • Sharpe Ratio indicates the average return minus the risk-free return divided by the standard deviation of return on an investment for a risk-adjusted return measure.
  • Standard Deviation is a measure of risk that shows how much returns might vary for investors.
  • Maximum Drawdown shows how much an investment has fallen from a previous peak and indicates its possible negative impact on a portfolio.
  • Stock Market Risk or “Beta” shows how much an investment moves in-line with the broad stock market. Investments with weaker relationships to traditional asset classes can buffer against broad market declines.
  • Excess Return or “Alpha” shows an investment’s over- or underperformance relative to an index, which in this case is the broad stock market.

With these definitions in mind let’s size up several portfolios. One consists of all stocks, one is a traditional 60% stock, 40% bond portfolio, and the third adds a tactical high yield alternative investment strategy to the 60%-40% portfolio.

Traditional 60-40 vs. 45-25-30 with High Yield Strategy

Star Graph - Traditional 60-40 vs. 45-25-30 with High Yield Strategy Investment Metrics
Source: Morningstar. Displayed above are scenarios using the S&P 500 Total Return Index to represent “Stocks,” the Bloomberg Barclays US Treasury 7-10 Year Index to represent “Treasuries,” and a High Yield Strategy in various combinations. The High Yield Strategy is defined by buying the Morningstar High Yield Category when it closes above its 200-day moving average the prior day. The strategy entirely switches to exposure of the Bloomberg U.S. Treasury 3-5 Year Total Return Index when the Morningstar High Yield Category closes below its 200-day moving average.

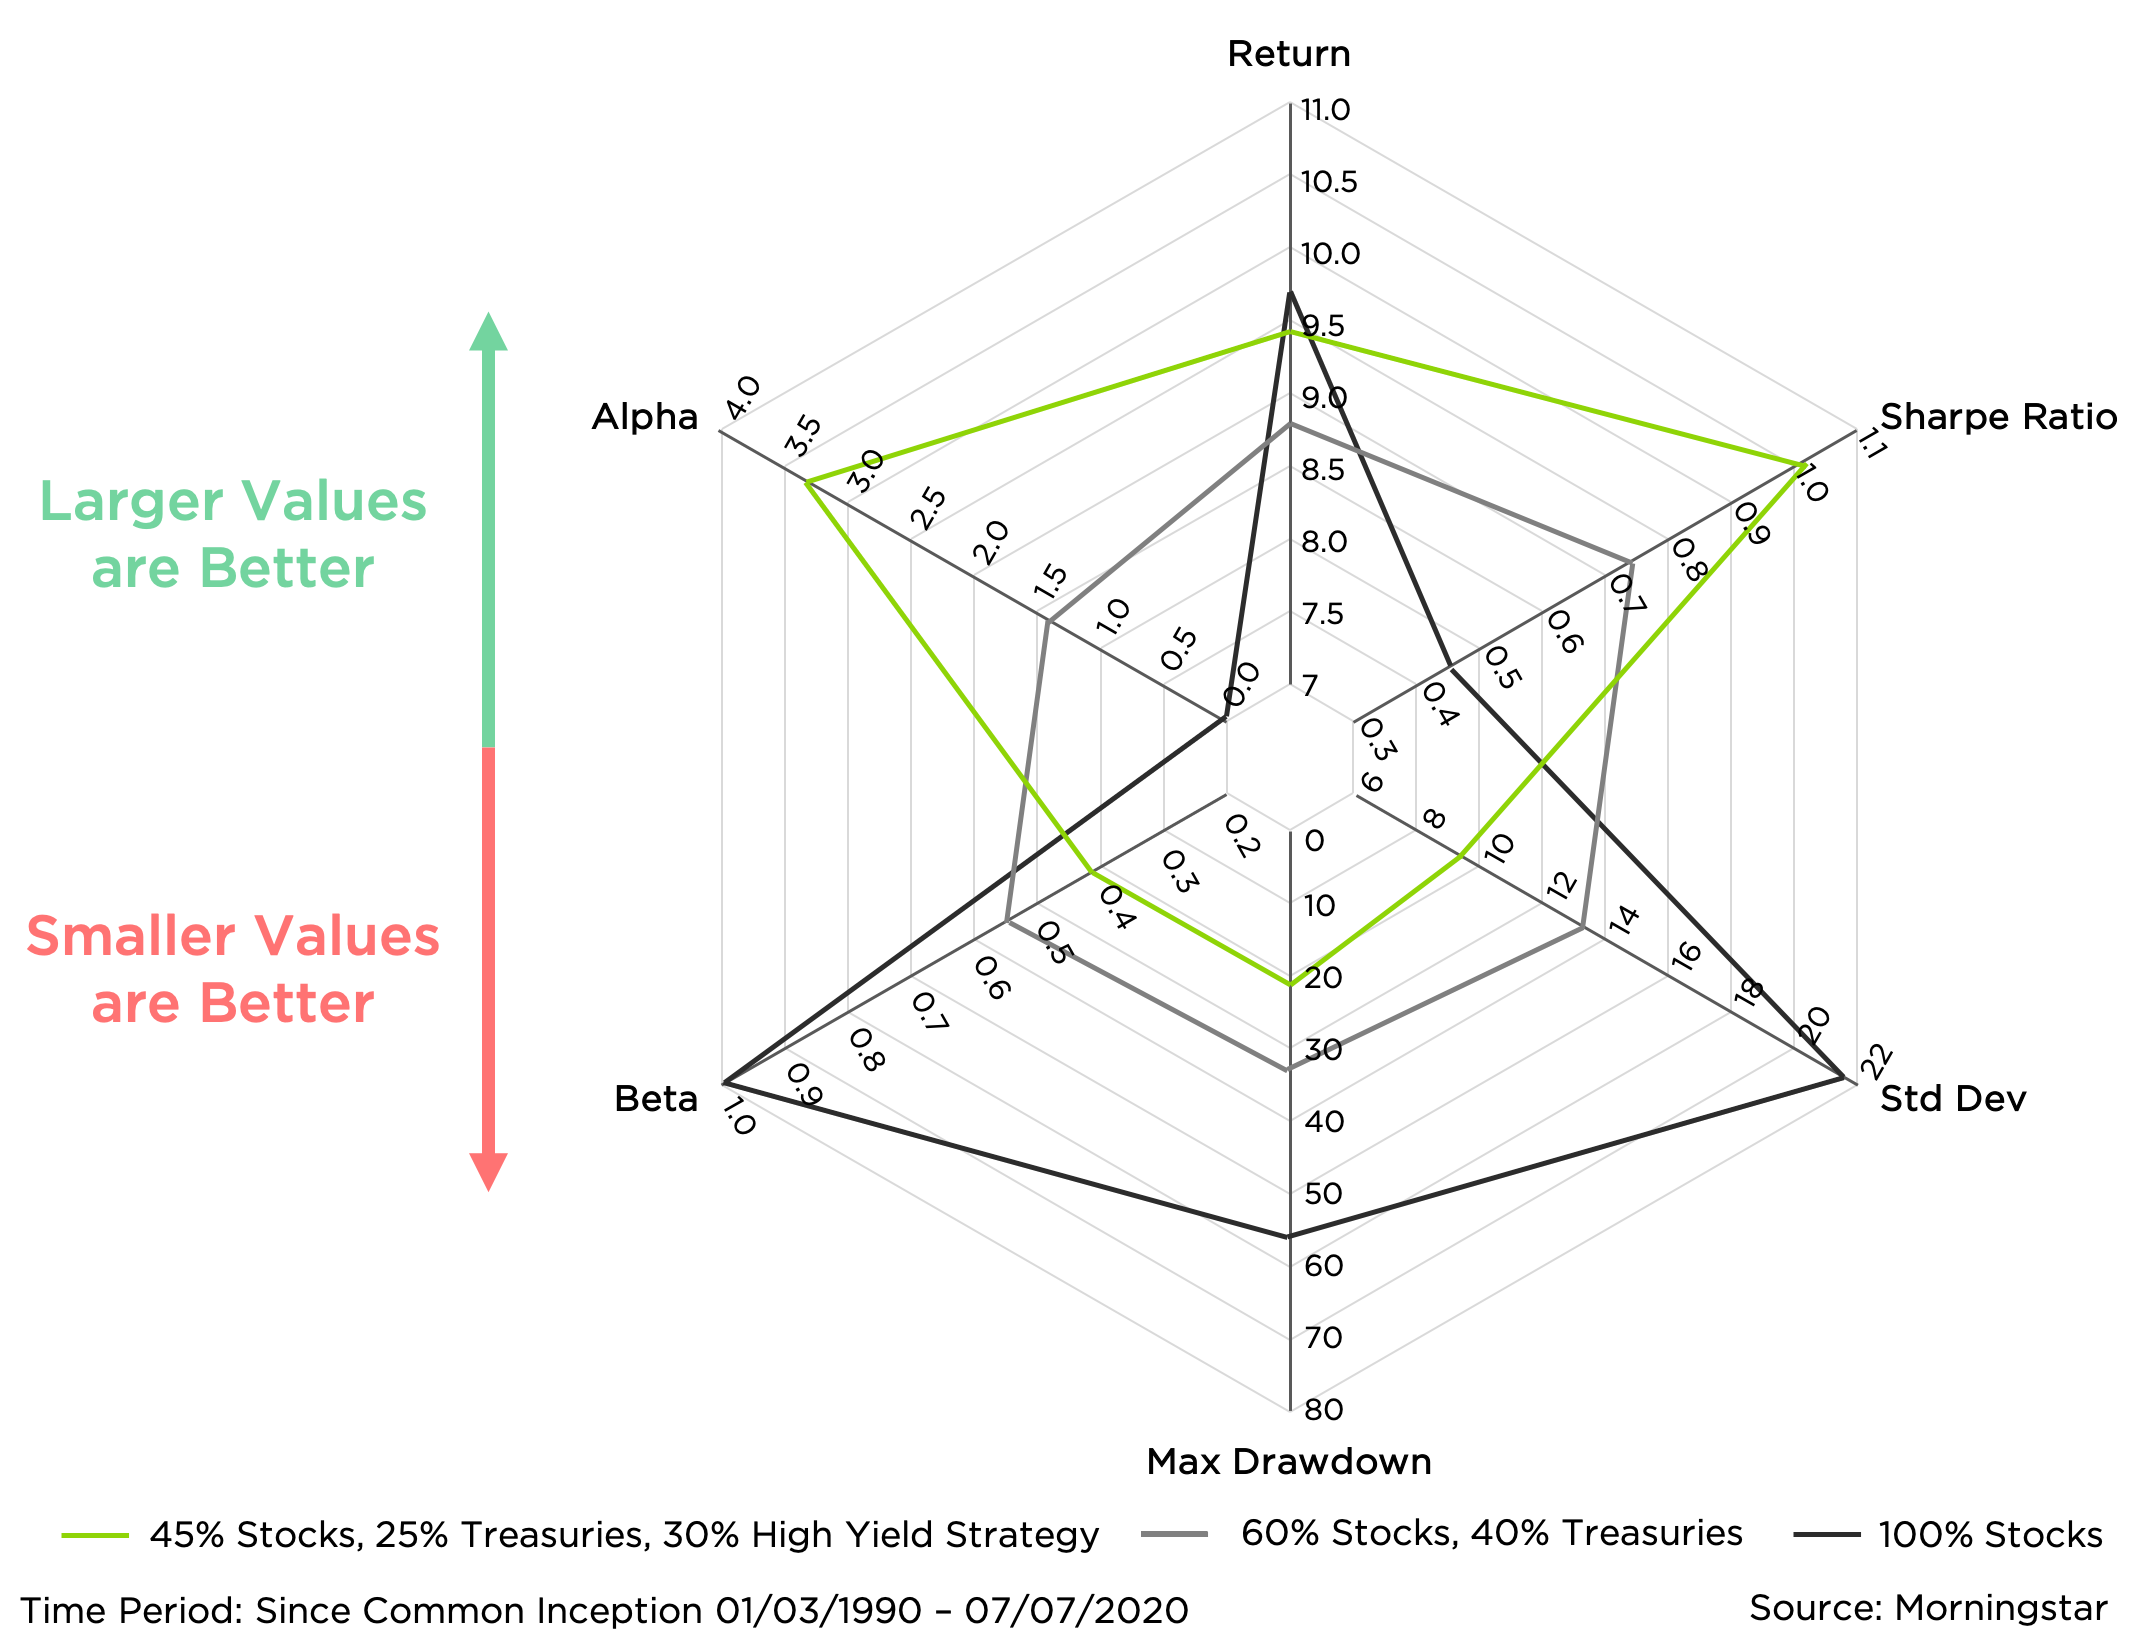
Stocks and bonds each have pronounced strengths and weaknesses. The addition of bonds to an all-stock portfolio improved the drawdown profile, reduced the portfolio’s relationship with stocks, and lowered standard deviation – potentially all good things. Stocks, meanwhile, had a higher annualized return – but they had the worst drawdown profile and did not diversify away stock market risk.

The addition of a tactical high yield strategy, an alternative asset class diversifier, to a portfolio further improved upon the benefits associated with stocks and bonds. Returns were higher than the traditional 60/40 portfolio but lower than the 100% stock portfolio, while standard deviation, max drawdown, stock market beta, and excess return alpha measures showed meaningful improvement. The charts below show how these dynamics play out for investors over time.

Traditional 60-40 vs. 45-25-30 with High Yield Strategy

Time Series - Traditional 60-40 vs. 45-25-30 with High Yield Strategy
Source: Morningstar Direct

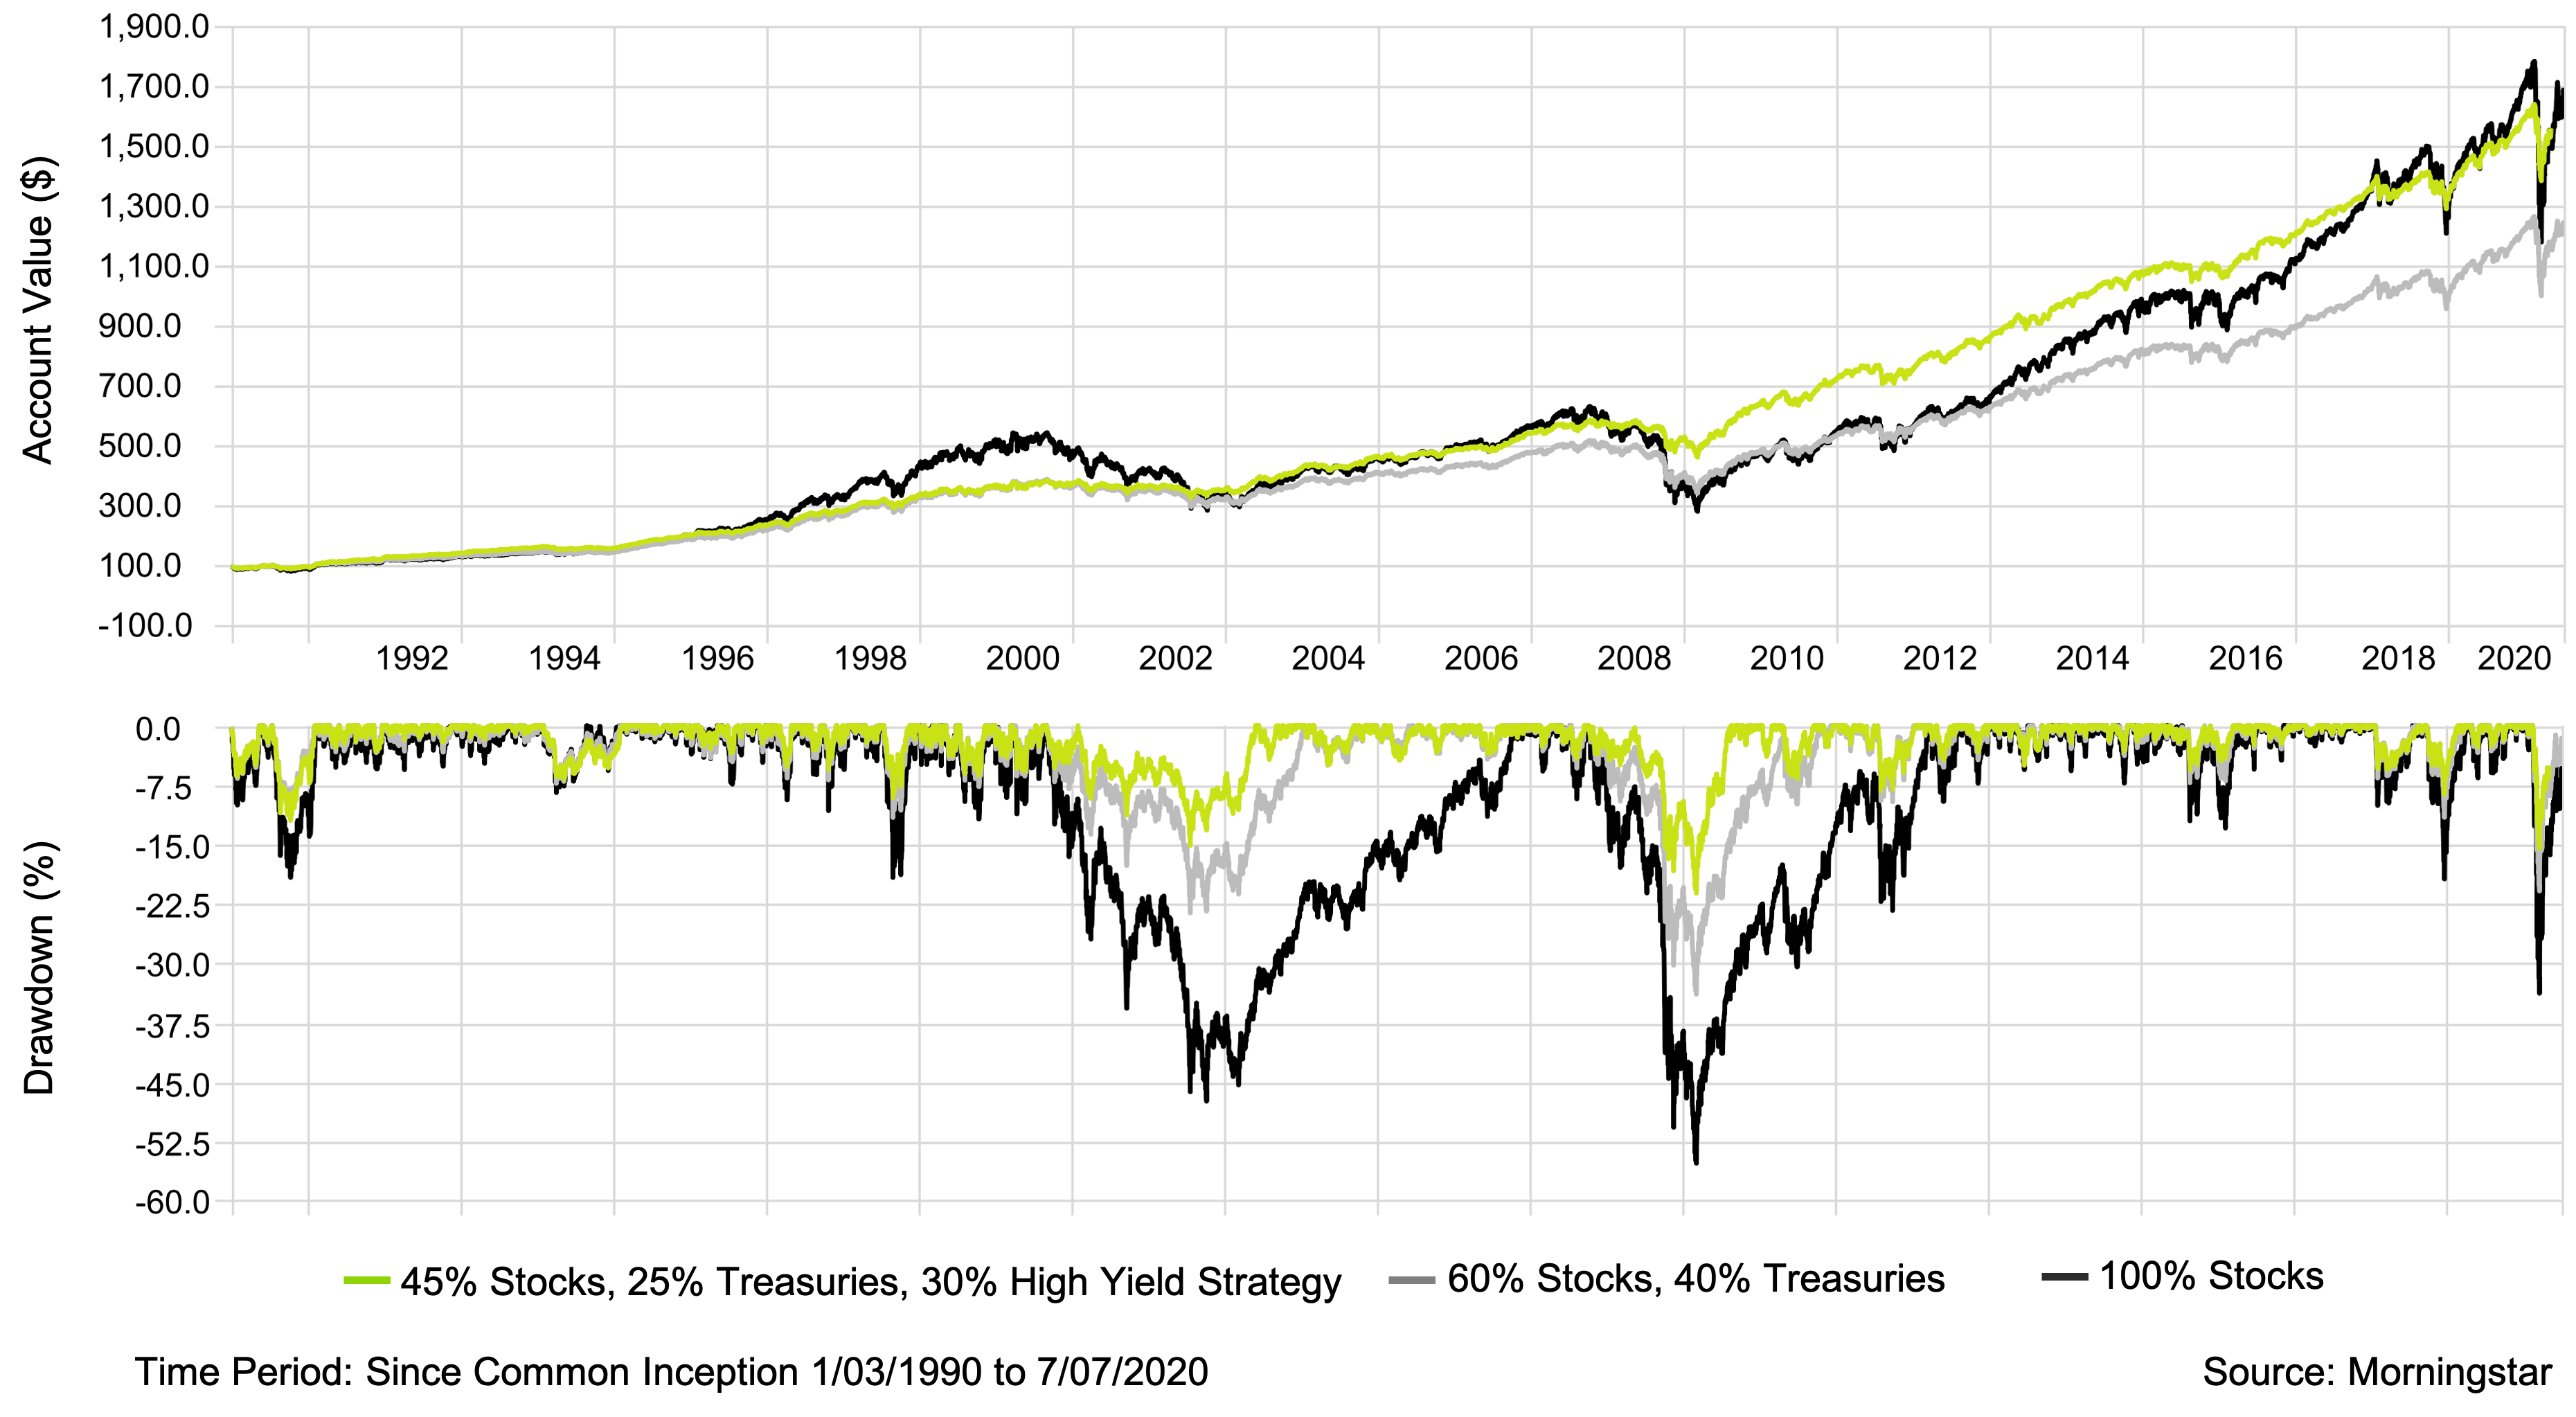
Because tactical high yield strategies seek to systematically manage risk, they can extend traditional diversification benefits. Blending stocks and bonds together reduced annual returns but created benefits in terms of standard deviation and maximum drawdown. Adding tactical high yield to a portfolio has been shown to further extend the standard deviation and drawdown benefits – without sacrificing returns or taking on additional stock or bond market risk.

Historically, allocating a portion of a portfolio to a tactical high yield diversifier strategy has potential to improve maximum drawdown and standard deviation, with only a small sacrifice of returns and a reduced correlation with the stock and bond markets.

Important Risk Information

Investments cannot be made in an index. Unmanaged index returns do not reflect any fees, expenses or sales charges. Past performance is no guarantee of future results. There is no guarantee that any investment will achieve its objectives, generate positive returns, or avoid losses. The Adviser’s reliance on its strategy and judgments about the attractiveness, value and potential appreciation of particular securities and the tactical allocation among investments may prove to be incorrect and may not produce the desired results. No level of diversification or non-correlation can ensure profits or guarantee against loss

Index Definitions

The S&P 500 is widely regarded as the best single gauge of large-cap U.S. equities and serves as and captures approximately 80% coverage of available US equity market capitalization. Fixed Income allocation is represented by the Bloomberg Barclays US Treasury 7-10 Year Index, which measures total return of US dollar-denominated, fixed-rate, nominal debt issued by the US Treasury with 7-9.9999 years to maturity. The High Yield Strategy is defined by buying the Morningstar High Yield Category when it closes above its 200-day moving average the prior day. The strategy entirely switches to exposure of the Bloomberg U.S. Treasury 3-5 Year Total Return Index when the Morningstar High Yield Category closes below its 200-day moving average.

Investors should carefully consider the investment objectives, risks, charges and expenses of the funds managed by Counterpoint Mutual Funds. This and other important information about the funds are available in their prospectuses, which can be obtained at counterpointfunds.com or by calling 844-273-8637. The prospectuses should be read carefully before investing. The Counterpoint Mutual Funds fund family is distributed by Northern Lights Distributors, LLC member FINRA/SIPC. Counterpoint Mutual Funds, LLC is not affiliated with Northern Lights Distributors, LLC member FINRA/SIPC.

3814-NLD-7/16/2020

Recent Perspectives

Factor Strategies March to a Different Beat

Many investors agree: Active strategies that try to beat the stock market have periods where they perform well (contributing to outperformance) and periods where they perform poorly (contributing...

READ MORE

Mutual Funds involve risk including the possible loss of principal. Investors should carefully consider the investment objectives, risks, charges and expenses of the funds managed by Counterpoint Funds. This and other important information about the funds is available in their prospectuses, which can be obtained at counterpointfunds.com or by calling 844-273-8637. The prospectuses should be read carefully before investing. The Counterpoint Funds fund family is distributed by Northern Lights Distributors, LLC member FINRA/SIPC. To reach the Counterpoint sales team, please refer to our contact page.

5516-NLD-09/01/2021


Thank you!

We’ve received your request for the featured event collateral. A Counterpoint Funds team member will be in touch shortly.

Subscribe to stay up to date on and receive our monthly perspective.

Thank you!

We’ve received your meeting request and a Counterpoint Funds team member will be in touch shortly.

Subscribe to stay up to date on and receive our monthly perspective.

Thank you!

We’ve received your event registration request and will be in touch shortly.

Subscribe to stay up to date on Counterpoint Funds and receive our monthly perspective.

Thank you!

We have received your application and look forward to reviewing your qualifications for the role. If your application seems like a good fit, we will contact you to discuss next steps.

Thank you again for your application and interest in joining the Counterpoint team!

Thank you!

We’ve received your message. A Counterpoint Funds team member will contact you soon.

Subscribe to stay up to date and receive our monthly perspective.